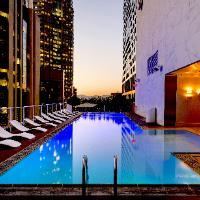
The restaurant industry in 2026 is defined by a digital-first guest journey, the dominance of mobile search, and the growing power of online reputation to make or break an independent venue.
60–65% of restaurant bookings are now made online — A figure that continues to rise — meaning the majority of your future covers are deciding whether to book you based entirely on your digital presence.
|
Metric |
2023 Figure |
2026 Estimate |
|
Global restaurant market size |
$3.5 trillion |
$3.9 trillion |
|
Online food delivery market (global) |
$320 billion |
$390 billion |
|
Share of restaurant bookings made online |
52% |
60–65% |
|
Diners influenced by online reviews |
84% |
87–90% |
|
Diners checking menu online before visit |
76% |
80–85% |
|
Mobile share of restaurant search traffic |
68% |
72–76% |
|
Revenue impact of 1-star review improvement |
+5–9% |
+5–9% (consistent) |
Table 1: Key restaurant industry statistics — global and European markets, 2026. Sources: Statista, Euromonitor, TheFork, OpenTable.
|
Digital Channel |
% of Restaurants Using |
Reported Impact on Covers |
|
Google Business Profile |
91% |
High (primary discovery channel) |
|
Social media (Instagram / Facebook) |
88% |
Medium-High (brand and discovery) |
|
Online reservation platform (TheFork / OpenTable) |
64% |
High (direct covers generation) |
|
Email marketing |
42% |
High (repeat visits, events) |
|
Own website with online booking |
68% |
Very High (direct, no commission) |
84–90% of diners are influenced by online reviews before choosing a restaurant — A restaurant with a 4.7 average on Google will consistently outperform an equally good restaurant at 4.3.
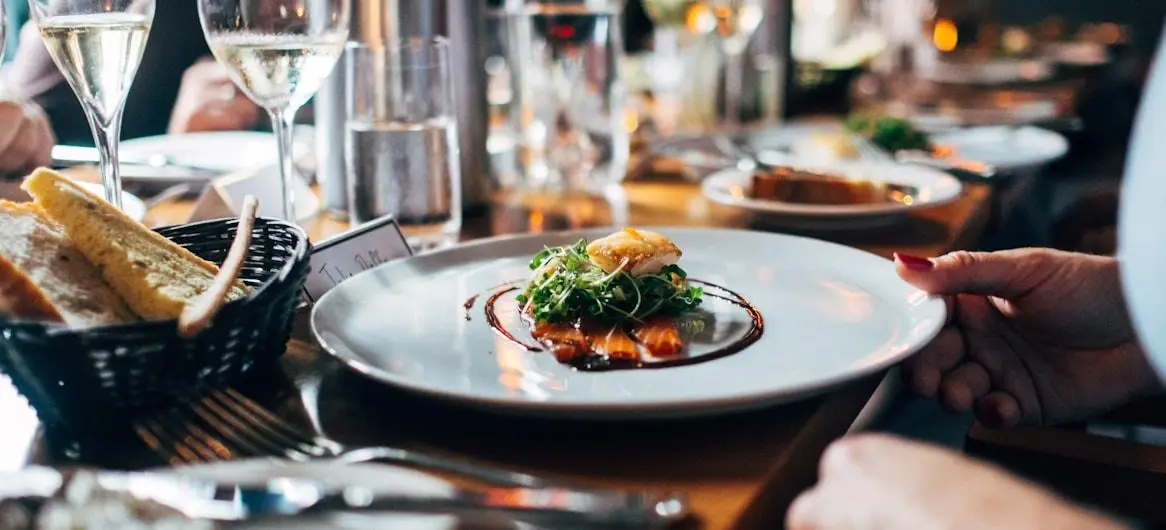
These statistics define the competitive environment in which every independent restaurant operates. The venues that perform best invest across all digital disciplines. Here is how each discipline contributes.
A strong brand is the foundation that makes every other marketing investment more efficient. Diners who have a clear sense of who you are — your personality, your story, your point of difference — are more likely to book direct, return, and recommend you.
Your website is where every marketing channel eventually lands. A fast, mobile-optimised restaurant website with a clear booking engine is the commercial engine that converts traffic into covers.
Search engine optimisation is the long-term channel that reduces your dependence on paid acquisition over time. A restaurant that ranks on page one for its core search terms captures demand at source, before the diner ever reaches a platform.
Paid media — Google Ads and Meta — provides immediate, controllable reach at the moment of highest intent. For restaurants, Google Ads on local restaurant search terms and branded search campaigns protect your direct reservations from platform commission bleed.
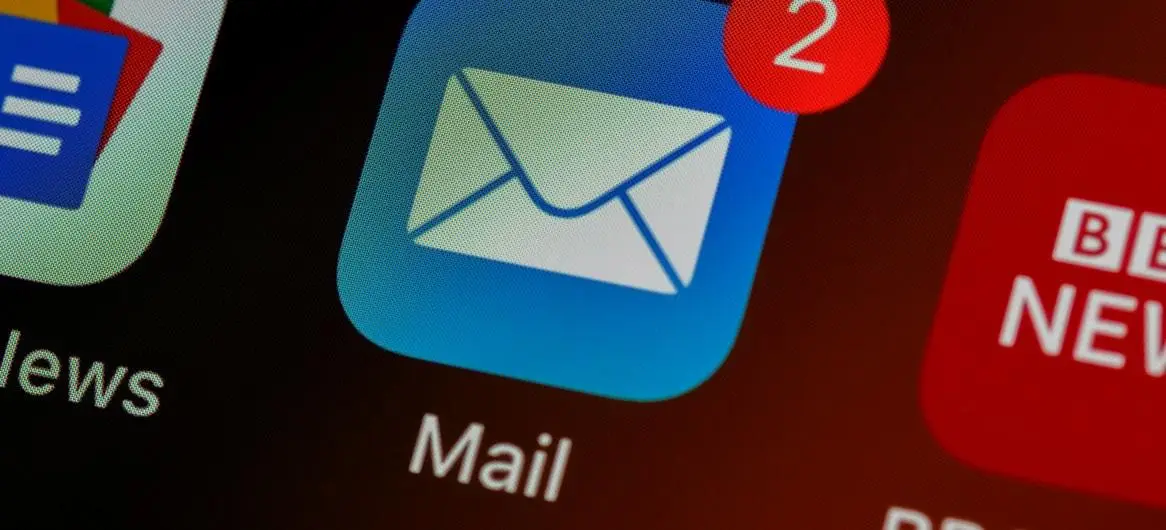
Email is the highest-ROI marketing channel available to independent restaurants. A diner who has already visited you costs €0.15–€0.60 per cover to re-engage via email — a fraction of the cost of acquiring them through any other channel.
You cannot manage what you cannot measure. Analytics and integrations — from GA4 to your reservation system and POS — give you the data to understand which channels are generating covers and what they are costing per cover.
A hospitality-specialist marketing agency brings the expertise, tools, and bandwidth to run a full-stack digital marketing strategy — from brand positioning to paid campaigns to email sequences to analytics — without the overhead of building an in-house team.
The Lobby provides digital marketing strategy and execution for independent restaurants across every discipline.